Visualising Playfair
Analysing historical graphs with Python
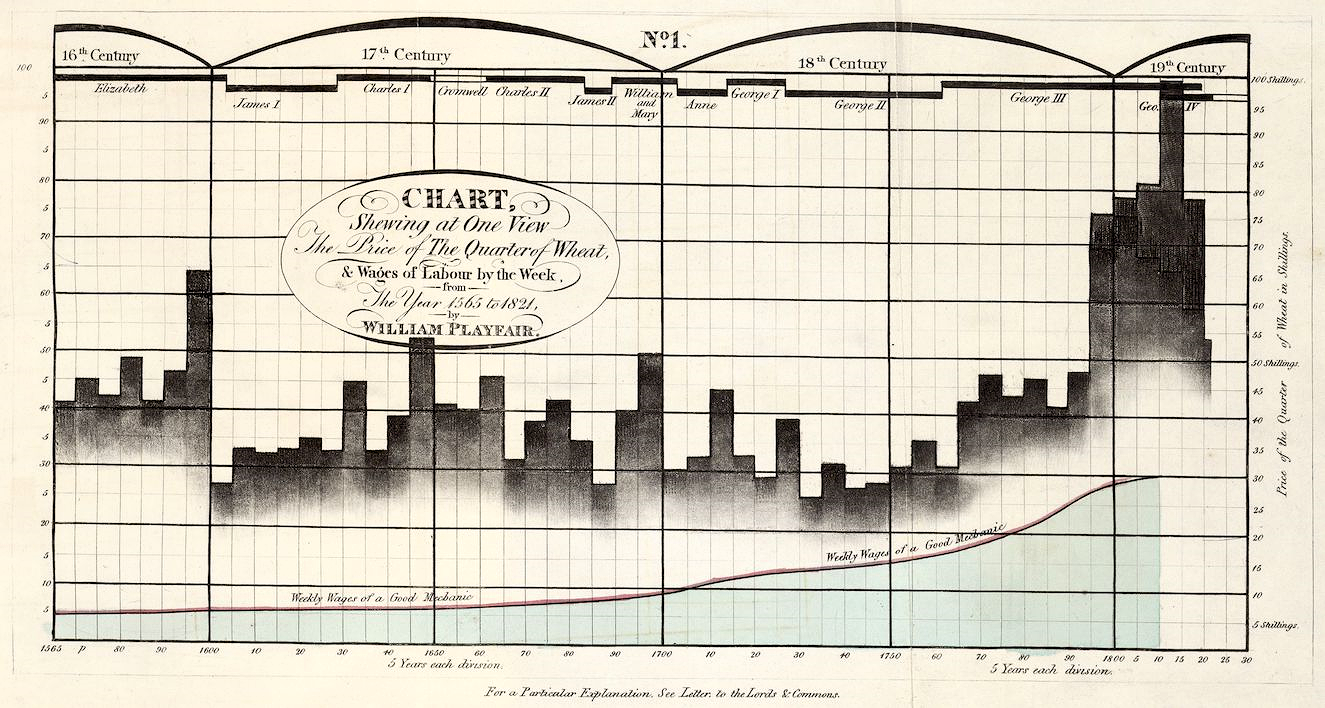
This Jupyter Book explores the work of William Playfair, who in 1786 published The Commercial and Political Atlas, the first book to represent statistical data graphically. Despite its significance, it went largely unnoticed for over 150 years. I investigate why by reconstructing Playfair’s graphs and examining his historical sources and numerical data.
Designed for historians without programming skills, the book offers step-by-step code explanations. If you have little interest in the code, no problem: just press play to run the cells and visualise the results.
Here you will find
Links to digital copies of Playfair’s works
Digitized historical sources forming the basis of his data
Python scripts (Pandas, Matplotlib, Plotly)
Explanation about the code and
Most fun of all: old-school historical analysis ;)